
Articoli correlati a Show Me the Numbers: Designing Tables and Graphs to...
Sinossi
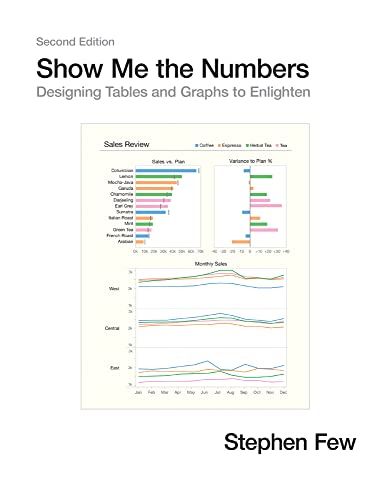
Addressing the prevalent issue of poorly designed quantitative information presentations, this accessible, practical, and comprehensive guide teaches how to properly create tables and graphs for effective and efficient communication. The critical numbers that measure the health, identify the opportunities, and forecast the future of organizations are often misrepresented because few people are trained to design accurate, informative materials, but this manual helps put an end to misinformation. This revised edition of the highly successful book includes updated figures and 91 additional pages of content, including new chapters about quantitative narrative and current misuses of graphs―such as donut, circle, unit, and funnel charts―and new appendices that cover constructing table lens displays and box plots in Excel and useful color palettes for presentation materials.
Le informazioni nella sezione "Riassunto" possono far riferimento a edizioni diverse di questo titolo.
Informazioni sull'autore
Stephen Few is the founder of the consultancy Perceptual Edge. He speaks, teaches, and consults around the world and writes the quarterly Visual Business Intelligence Newsletter. He is the author of Information Dashboard Design: The Effective Visual Communication of Data and Now You See It: Simple Visualization Techniques for Quantitative Analysis. He lives in Berkeley, California.
Le informazioni nella sezione "Su questo libro" possono far riferimento a edizioni diverse di questo titolo.
Risultati della ricerca per Show Me the Numbers: Designing Tables and Graphs to...

Immagini fornite dal venditore
Show Me the Numbers: Designing Tables and Graphs to Enlighten
Da: 2nd Life Books, Burlington, NJ, U.S.A.
Valutazione del venditore 5 su 5 stelle

Condizione: acceptable. A readable copy. All pages are intact, and the cover is intact. Dust jacket may be missing. Pages can include considerable highlighting markings writing but cannot obscure the text. May be an Ex-lib. copy and have standard library stamps and or stickers. May NOT include discs, or access code or other supplemental material. We ship Monday-Saturday and respond to inquiries within 24 hours. Codice articolo BXM.FCH5
Compra usato
EUR 1,85
Spedizione EUR 3,58
Spedito in U.S.A.
Spedito in U.S.A.
Quantità: 1 disponibili
Foto dell'editore
Show Me the Numbers: Designing Tables and Graphs to Enlighten
Da: World of Books (was SecondSale), Montgomery, IL, U.S.A.
Valutazione del venditore 5 su 5 stelle
Hardback. Condizione: Good. Addressing the prevalent issue of poorly designed quantitative information presentations, this accessible, practical, and comprehensive guide teaches how to properly create tables and graphs for effective and efficient communication. The critical numbers that measure the health, identify the opportunities, and forecast the future of organizations are often misrepresented because few people are trained to design accurate, informative materials, but this manual helps put an end to misinformation. This revised edition of the highly successful book includes updated figures and 91 additional pages of content, including new chapters about quantitative narrative and current misuses of graphs--such as donut, circle, unit, and funnel charts--and new appendices that cover constructing table lens displays and box plots in Excel and useful color palettes for presentation materials. Codice articolo 00109888801
Compra usato
EUR 5,53
Spedizione gratuita
Spedito in U.S.A.
Spedito in U.S.A.
Quantità: 7 disponibili
Foto dell'editore
Show Me the Numbers: Designing Tables and Graphs to Enlighten
Da: More Than Words, Waltham, MA, U.S.A.
Valutazione del venditore 5 su 5 stelle
Condizione: Good. A sound copy with only light wear. Overall a solid copy at a great price! Codice articolo BOS-A-09d-0001783
Compra usato
EUR 2,77
Spedizione EUR 3,58
Spedito in U.S.A.
Spedito in U.S.A.
Quantità: 1 disponibili
Foto dell'editore
Show Me the Numbers: Designing Tables and Graphs to Enlighten
Da: Evergreen Goodwill, Seattle, WA, U.S.A.
Valutazione del venditore 5 su 5 stelle
hardcover. Condizione: Acceptable. Codice articolo mon0000814296
Compra usato
EUR 2,77
Spedizione EUR 3,58
Spedito in U.S.A.
Spedito in U.S.A.
Quantità: 1 disponibili
Foto dell'editore
Show Me the Numbers: Designing Tables and Graphs to Enlighten
Da: ThriftBooks-Dallas, Dallas, TX, U.S.A.
Valutazione del venditore 5 su 5 stelle
Hardcover. Condizione: Fair. No Jacket. Missing dust jacket; Readable copy. Pages may have considerable notes/highlighting. ~ ThriftBooks: Read More, Spend Less. Codice articolo G0970601972I5N01
Compra usato
EUR 6,54
Spedizione gratuita
Spedito in U.S.A.
Spedito in U.S.A.
Quantità: 1 disponibili
Foto dell'editore
Show Me the Numbers: Designing Tables and Graphs to Enlighten
Da: ThriftBooks-Dallas, Dallas, TX, U.S.A.
Valutazione del venditore 5 su 5 stelle
Hardcover. Condizione: Fair. No Jacket. Readable copy. Pages may have considerable notes/highlighting. ~ ThriftBooks: Read More, Spend Less. Codice articolo G0970601972I5N00
Compra usato
EUR 6,54
Spedizione gratuita
Spedito in U.S.A.
Spedito in U.S.A.
Quantità: 1 disponibili
Foto dell'editore
Show Me the Numbers: Designing Tables and Graphs to Enlighten
Da: World of Books Inc, Montgomery, IL, U.S.A.
Valutazione del venditore 4 su 5 stelle

Hardback. Condizione: Good. Addressing the prevalent issue of poorly designed quantitative information presentations, this accessible, practical, and comprehensive guide teaches how to properly create tables and graphs for effective and efficient communication. The critical numbers that measure the health, identify the opportunities, and forecast the future of organizations are often misrepresented because few people are trained to design accurate, informative materials, but this manual helps put an end to misinformation. This revised edition of the highly successful book includes updated figures and 91 additional pages of content, including new chapters about quantitative narrative and current misuses of graphs--such as donut, circle, unit, and funnel charts--and new appendices that cover constructing table lens displays and box plots in Excel and useful color palettes for presentation materials. Codice articolo CIN0970601972G
Compra usato
EUR 7,38
Spedizione gratuita
Spedito in U.S.A.
Spedito in U.S.A.
Quantità: 7 disponibili
Foto dell'editore
Show Me the Numbers: Designing Tables and Graphs to Enlighten
Da: HPB-Red, Dallas, TX, U.S.A.
Valutazione del venditore 5 su 5 stelle
Hardcover. Condizione: Good. Connecting readers with great books since 1972! Used textbooks may not include companion materials such as access codes, etc. May have some wear or writing/highlighting. We ship orders daily and Customer Service is our top priority! Codice articolo S_478063023
Compra usato
EUR 4,62
Spedizione EUR 3,36
Spedito in U.S.A.
Spedito in U.S.A.
Quantità: 1 disponibili
Immagini fornite dal venditore
Show Me the Numbers: Designing Tables and Graphs to Enlighten
Da: Goodwill Books, Hillsboro, OR, U.S.A.
Valutazione del venditore 5 su 5 stelle
Condizione: acceptable. Fairly worn, but readable and intact. If applicable: Dust jacket, disc or access code may not be included. Codice articolo GICWV.0970601972.A
Compra usato
EUR 4,42
Spedizione EUR 3,58
Spedito in U.S.A.
Spedito in U.S.A.
Quantità: 1 disponibili
Foto dell'editore
Show Me the Numbers: Designing Tables and Graphs to Enlighten
Da: AwesomeBooks, Wallingford, Regno Unito
Valutazione del venditore 5 su 5 stelle
hardcover. Condizione: Very Good. Show Me the Numbers: Designing Tables and Graphs to Enlighten This book is in very good condition and will be shipped within 24 hours of ordering. The cover may have some limited signs of wear but the pages are clean, intact and the spine remains undamaged. This book has clearly been well maintained and looked after thus far. Money back guarantee if you are not satisfied. See all our books here, order more than 1 book and get discounted shipping. Codice articolo 7719-9780970601971
Compra usato
EUR 4,26
Spedizione EUR 4,94
Spedito da Regno Unito a U.S.A.
Spedito da Regno Unito a U.S.A.
Quantità: 2 disponibili