
Articoli correlati a The Definitive Guide to Point And Figure: A Comprehensive...
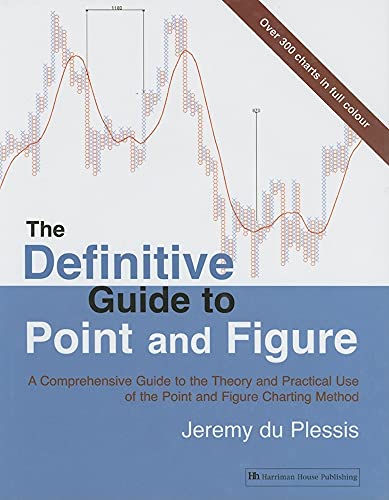
The Definitive Guide to Point And Figure: A Comprehensive Guide to the Theory And Practical Use of the Point And Figure Charting Method - Rilegato
Sinossi
<div>Point and Figure charts are one of the great secrets of the Technical Analysis world. Highly sophisticated and with a thoroughbred pedigree, they can, however, be overlooked by traders today. This should change with the long-awaited publication of this book. Jeremy du Plessis - one of the foremost Point and Figure experts in the world - has written what can truly be described as the definitive guide to the topic.For the first time this book thoroughly demystifies the world of Point and Figure charting, with a detailed explanation of the history and development of the technique from its invention to the modern day. The book covers the makeup of the chart patterns, why they are created, and their interpretation. Throughout, readers are encouraged to understand Point and Figure charts from first principles, rather than just remember the names of a series of patterns. It is the first major work for 50 years to discuss in depth the original 1-box reversal method of Point and Figure charting and contrast it with the more popular 3-box reversal method. Further, the explanation of how to use Point and Figure charts to project targets and calculate risk-reward ratios is the most comprehensive ever seen.Also covered in detail are: - A step-by-step analysis of the FTSE 100 Index using the 3-box method, as well as the NASDAQ Composite Index using the 1-box method.- A detailed discussion of optimising techniques.- Point and Figure's contribution to market breadth with bullish percent.- Lesser known, more advanced techniques such as the use of moving averages, parabolic SAR and Bollinger Bands on Point and Figure charts.All this is illustrated with numerous colour charts and observations from yearsof trading e</div>
Le informazioni nella sezione "Riassunto" possono far riferimento a edizioni diverse di questo titolo.
Product Description
Book by Du Plessis Jeremy
Le informazioni nella sezione "Su questo libro" possono far riferimento a edizioni diverse di questo titolo.
Risultati della ricerca per The Definitive Guide to Point And Figure: A Comprehensive...

Foto dell'editore
The Definitive Guide to Point and Figure: A Comprehensive Guide to the Theory and Practical Use of the Point and Figure Charting Method
Editore:
Harriman House Publishing, 2005
ISBN 10: 1897597630
ISBN 13: 9781897597637
Antico o usato
Rilegato
Da: World of Books (was SecondSale), Montgomery, IL, U.S.A.
Valutazione del venditore 5 su 5 stelle

Hardback. Condizione: Very Good. Point and Figure charts are one of the great secrets of the Technical Analysis world. Highly sophisticated and with a thoroughbred pedigree, they can, however, be overlooked by traders today. Jeremy du Plessis - one of the foremost Point and Figure experts in the world - returns with a fully updated second edition of this definitive guide in an effort to redress this imbalance. This second edition, with an extensive revision to the text and introduction of brand new techniques, demystifies the world of Point and Figure charting. It includes a detailed explanation of the history and development of the technique from its invention to the modern day, and covers the makeup of the chart patterns, why they are created, and how to interpret them. Throughout, readers are encouraged to understand Point and Figure charts from first principles, rather than just remember the names of a series of patterns. It is the first major work for 50 years to discuss in depth the original 1-box reversal method of Point and Figure charting and contrast it with the more popular 3-box reversal method. Further, the explanation of how to use Point and Figure charts to project targets and calculate risk-reward ratios is the most comprehensive ever seen. Also featured in the second edition are: - A step-by-step analysis of the FTSE 100 Index using the 3-box method, as well as the NASDAQ Composite Index, using the 1-box method - A detailed discussion of optimising techniques - An in-depth chapter on Analysing Point and Figure charts, extensively rewritten from the first edition - A new explanation of how Point and Figure parameters are chosen and the implications of choosing them - Two new Point and Figure construction methods never seen before - Point and Figure's contribution to market breadth, with a look at bullish percent and two brand new indicators - Full discussion of Point and Figure gaps and how they provide valuable information about the chart - Lesser known, more advanced techniques such as the use of moving averages, parabolic SAR and Bollinger Bands on Point and Figure charts - Price and volume activity histograms and how they provide information about support and resistance All this is illustrated with numerous colour charts and observations from years of trading experience. According to du Plessis, Point and Figure charts are the 'voice of the market'. This book helps you listen to, and understand, that voice. Part of the Market Technicians Association (MTA) Required Reading list. Codice articolo 00105305146
Compra usato
EUR 9,09
Spedizione gratuita
Spedito in U.S.A.
Spedito in U.S.A.
Quantità: 1 disponibili
Immagini fornite dal venditore
The Definitive Guide to Point And Figure: A Comprehensive Guide to the Theory And Practical Use of the Point And Figure Charting Method
Editore:
Harriman House Pub, 2005
ISBN 10: 1897597630
ISBN 13: 9781897597637
Antico o usato
Rilegato
Da: Gate City Books, GREENSBORO, NC, U.S.A.
Valutazione del venditore 5 su 5 stelle
Condizione: good. USED book in GOOD condition. Great binding, pages and cover show normal signs of wear from use. Codice articolo GCM.3H8N
Compra usato
EUR 9,10
Spedizione gratuita
Spedito in U.S.A.
Spedito in U.S.A.
Quantità: 1 disponibili
Immagini fornite dal venditore
The Definitive Guide to Point And Figure: A Comprehensive Guide to the Theory And Practical Use of the Point And Figure Charting Method
Editore:
Harriman House Pub, 2005
ISBN 10: 1897597630
ISBN 13: 9781897597637
Antico o usato
Rilegato
Da: Zoom Books East, Glendale Heights, IL, U.S.A.
Valutazione del venditore 5 su 5 stelle
Condizione: very_good. Book is in very good condition and may include minimal underlining highlighting. The book can also include "From the library of" labels. May not contain miscellaneous items toys, dvds, etc. . We offer 100% money back guarantee and 24 7 customer service. Codice articolo ZEV.1897597630.VG
Compra usato
EUR 9,15
Spedizione gratuita
Spedito in U.S.A.
Spedito in U.S.A.
Quantità: 1 disponibili
Foto dell'editore
The Definitive Guide to Point and Figure: A Comprehensive Guide to the Theory and Practical Use of the Point and Figure Charting Method
Editore:
Harriman House Pub, 2005
ISBN 10: 1897597630
ISBN 13: 9781897597637
Antico o usato
Rilegato
Da: WorldofBooks, Goring-By-Sea, WS, Regno Unito
Valutazione del venditore 5 su 5 stelle
Hardback. Condizione: Very Good. The book has been read, but is in excellent condition. Pages are intact and not marred by notes or highlighting. The spine remains undamaged. Codice articolo GOR002558152
Compra usato
EUR 3,40
Spedizione EUR 6,62
Spedito da Regno Unito a U.S.A.
Spedito da Regno Unito a U.S.A.
Quantità: 3 disponibili
Foto dell'editore
The Definitive Guide to Point and Figure: A Comprehensive Guide to the Theory and Practical Use of the Point and Figure Charting Method
Da: HPB-Red, Dallas, TX, U.S.A.
Valutazione del venditore 5 su 5 stelle
Hardcover. Condizione: Acceptable. Connecting readers with great books since 1972. Used textbooks may not include companion materials such as access codes, etc. May have condition issues including wear and notes/highlighting. We ship orders daily and Customer Service is our top priority! Codice articolo S_477038185
Compra usato
EUR 7,38
Spedizione EUR 3,35
Spedito in U.S.A.
Spedito in U.S.A.
Quantità: 1 disponibili
Foto dell'editore
The Definitive Guide to Point and Figure: A Comprehensive Guide to the Theory and Practical Use of the Point and Figure Charting Method
Da: HPB-Red, Dallas, TX, U.S.A.
Valutazione del venditore 5 su 5 stelle
Hardcover. Condizione: Good. Connecting readers with great books since 1972! Used textbooks may not include companion materials such as access codes, etc. May have some wear or writing/highlighting. We ship orders daily and Customer Service is our top priority! Codice articolo S_478574152
Compra usato
EUR 7,43
Spedizione EUR 3,35
Spedito in U.S.A.
Spedito in U.S.A.
Quantità: 1 disponibili
Foto dell'editore
The Definitive Guide to Point and Figure: A Comprehensive Guide to the Theory and Practical Use of the Point and Figure Charting Method
Editore:
Harriman House Publishing, 2005
ISBN 10: 1897597630
ISBN 13: 9781897597637
Antico o usato
Rilegato
Da: World of Books Inc, Montgomery, IL, U.S.A.
Valutazione del venditore 4 su 5 stelle

Hardback. Condizione: Very Good. Point and Figure charts are one of the great secrets of the Technical Analysis world. Highly sophisticated and with a thoroughbred pedigree, they can, however, be overlooked by traders today. Jeremy du Plessis - one of the foremost Point and Figure experts in the world - returns with a fully updated second edition of this definitive guide in an effort to redress this imbalance. This second edition, with an extensive revision to the text and introduction of brand new techniques, demystifies the world of Point and Figure charting. It includes a detailed explanation of the history and development of the technique from its invention to the modern day, and covers the makeup of the chart patterns, why they are created, and how to interpret them. Throughout, readers are encouraged to understand Point and Figure charts from first principles, rather than just remember the names of a series of patterns. It is the first major work for 50 years to discuss in depth the original 1-box reversal method of Point and Figure charting and contrast it with the more popular 3-box reversal method. Further, the explanation of how to use Point and Figure charts to project targets and calculate risk-reward ratios is the most comprehensive ever seen. Also featured in the second edition are: - A step-by-step analysis of the FTSE 100 Index using the 3-box method, as well as the NASDAQ Composite Index, using the 1-box method - A detailed discussion of optimising techniques - An in-depth chapter on Analysing Point and Figure charts, extensively rewritten from the first edition - A new explanation of how Point and Figure parameters are chosen and the implications of choosing them - Two new Point and Figure construction methods never seen before - Point and Figure's contribution to market breadth, with a look at bullish percent and two brand new indicators - Full discussion of Point and Figure gaps and how they provide valuable information about the chart - Lesser known, more advanced techniques such as the use of moving averages, parabolic SAR and Bollinger Bands on Point and Figure charts - Price and volume activity histograms and how they provide information about support and resistance All this is illustrated with numerous colour charts and observations from years of trading experience. According to du Plessis, Point and Figure charts are the 'voice of the market'. This book helps you listen to, and understand, that voice. Part of the Market Technicians Association (MTA) Required Reading list. Codice articolo CIN1897597630VG
Compra usato
EUR 10,93
Spedizione gratuita
Spedito in U.S.A.
Spedito in U.S.A.
Quantità: 1 disponibili
Immagini fornite dal venditore
The Definitive Guide to Point And Figure: A Comprehensive Guide to the Theory And Practical Use of the Point And Figure Charting Method
Editore:
Harriman House Pub, 2005
ISBN 10: 1897597630
ISBN 13: 9781897597637
Antico o usato
Rilegato
Da: Goodwill Books, Hillsboro, OR, U.S.A.
Valutazione del venditore 5 su 5 stelle
Condizione: acceptable. Fairly worn, but readable and intact. If applicable: Dust jacket, disc or access code may not be included. Codice articolo GICWV.1897597630.A
Compra usato
EUR 7,43
Spedizione EUR 3,56
Spedito in U.S.A.
Spedito in U.S.A.
Quantità: 1 disponibili
Foto dell'editore
The Definitive Guide to Point And Figure: A Comprehensive Guide to the Theory And Practical Use of the Point And Figure Charting Method
Editore:
Harriman House Pub, 2005
ISBN 10: 1897597630
ISBN 13: 9781897597637
Antico o usato
Rilegato
Da: ThriftBooks-Atlanta, AUSTELL, GA, U.S.A.
Valutazione del venditore 5 su 5 stelle
Hardcover. Condizione: Very Good. No Jacket. May have limited writing in cover pages. Pages are unmarked. ~ ThriftBooks: Read More, Spend Less. Codice articolo G1897597630I4N00
Compra usato
EUR 11,03
Spedizione gratuita
Spedito in U.S.A.
Spedito in U.S.A.
Quantità: 1 disponibili
Foto dell'editore
The Definitive Guide to Point And Figure: A Comprehensive Guide to the Theory And Practical Use of the Point And Figure Charting Method
Editore:
Harriman House Pub, 2005
ISBN 10: 1897597630
ISBN 13: 9781897597637
Antico o usato
Rilegato
Da: ThriftBooks-Atlanta, AUSTELL, GA, U.S.A.
Valutazione del venditore 5 su 5 stelle
Hardcover. Condizione: Fair. No Jacket. Readable copy. Pages may have considerable notes/highlighting. ~ ThriftBooks: Read More, Spend Less. Codice articolo G1897597630I5N00
Compra usato
EUR 11,03
Spedizione gratuita
Spedito in U.S.A.
Spedito in U.S.A.
Quantità: 1 disponibili